1 Istituto Miglioramento Genetico Piante Forestali,
Consiglio Nazionale delle Ricerche,
2 Eidgenössische Forschungsanstalt für Wald, Schnee
und Landschaft,
3 Institut für Forstgenetik und Forstpflanzenzüchtung,
Bunderforschungsanstalt für Forst- und Holzwirtschaft,
*Corresponding author: Email: vendramin@imgpf.fi.cnr.it
Introduction
In recent years great efforts have been put on the identification of highly informative molecular markers for screening diversity in forest tree species. The identification of efficient methods, in terms of costs and time, for accurate analyses of patterns of diversity in forest trees is extremely relevant, because these organisms typically show a high level of variability, so that sampling of a large number of populations and individuals is required for each study. Microsatellites are tandem repeats characterised by short motifs (1 to 6 bp), a low degree of repetition (5 to 100 repeat units) and a randomly dispersed distribution of about 104 to 105 microsatellite regions per genome (Tautz, 1993). They display a presumably selectively neutral behaviour, show a co-dominant inheritance that allows discrimination of homo- and heterozygotic states, and occur frequently and evenly distributed throughout the genome. Their high degree of length polymorphism, which is due to different numbers of repeats within the microsatellite regions, can be easily and reproducibly detected via the polymerase chain reaction (PCR). Their main applications are in genome mapping and in population analysis, but microsatellites are also useful for taxonomy, parentage analysis, identification of individuals in forensic studies, and human cancer diagnostics.
Microsatellites are not limited to the nuclear genome. They occur in chloroplasts and also in the mitochondrial genome, as found by Soranzo et al. (1999) as a repetition of G/C. This study reviews work that was done in the field of chloroplast microsatellites in conifer species.
Chloroplast microsatellites (cpSSR)
The availability of the entire chloroplast sequence of the Japanese pine species Pinus thunbergii (Wakasugi et al., 1994) allowed the identification of cpSSR (chloroplast single sequence repeats). These microsatellites consist of repetitions of a single nucleotide (19 A/T and 1 G/C) (Powell et al., 1995; Vendramin et al., 1996). Primers for the amplification of chloroplast microsatellites were also recently designed for angiosperms (Weising and Gardner, 1999).
Considering that the chloroplast genome does not recombine due to its paternal inheritance in conifers (e.g. for cp-microsatellites: Cato and Richardson, 1996 ; Vendramin and Ziegenhagen, 1997; Sperisen et al., 1998) and maternal inheritance in angiosperms (e.g. for PCR/RFLP polymorphism in oaks: Dumolin et al., 1995), cpSSR variants accumulate in a uniparental chloroplast lineage and can thus provide information about the history of populations. Microsatellite variants are supposed to be generated in a stepwise manner by addition or deletion of single repeat units. Under such a stepwise mutation model (Valdes et al., 1993), microsatellite variants with small repeat length differences are more closely related than alleles with larger length differences, and consequently it can be considered that the process of mutation has a "memory" (Jarne and Lagoda, 1996). Computer simulations have produced linear relationships between genetic distances based on the size differences of the SSR alleles and the time of divergence (Slatkin, 1995; Goldstein et al., 1995).
Methods for the detection of chloroplast microsatellite polymorphism
Standard methods were optimised for the characterisation and the screening of chloroplast microsatellites in conifers. The main steps of the procedures for the amplification and detection of length polymorphism can be summarised as follows (for details see Vendramin et al., 1996).
PCR conditions
PCR amplifications were carried out using a Perkin Elmer model 9600 thermal cycler in a total volume of 25 ml containing 0.2 mM of each dNTPs, 2.5 mM of MgCl2, 0.2 mM of each primer, 10x reaction buffer (Pharmacia), 25 ng of template DNA and 1 unit of Pharmacia Taq polymerase, with the following profile: 5 min denaturation at 95°C, 5 min at 80°C enzyme addition, followed by 25 cycles of 1 min denaturation at 94°C, 1 min annealing at 55°C and 1 min extension at 72°C, with a final extension step of 72°C for 8 min. Amplification reactions were automatically prepared using a robotic workstation Biomek 2000 (Beckman Instruments). One of the two PCR primers in each reaction was 5' fluorescine-labelled.
Sizing and sequencing of amplification products
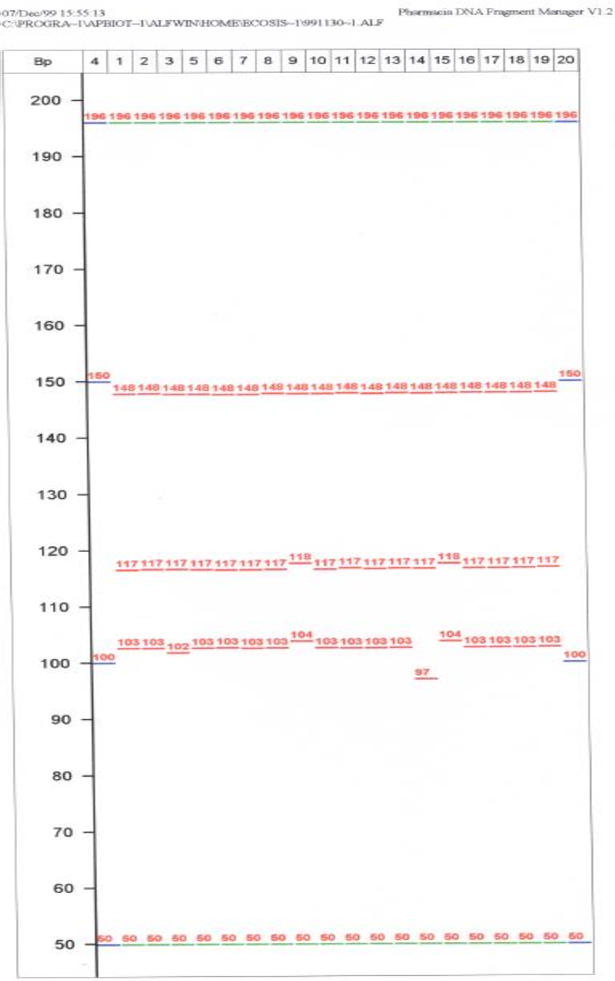
Several pairs of primers for the amplification of chloroplast microsatellites were designed in order to obtain fragments having different size ranges, thus allowing multiplexing by size range. Two or three microsatellite-producing fragments in different size ranges were simultaneously loaded together with internal molecular weight standards on a 6%, 20 cm long denaturating 7M urea, 0.6x Tris-Borate-EDTA polyacrilamide gel (Pharmacia) and run on an ALF automatic sequencer (Pharmacia) at 35 Watt constant power for approximately 80 minutes. The same gel was loaded twice. External molecular weight standards as well as internal standards (50, 100, 150 and 200 bp) were used in conjunction with the Fragment Manager version 1.2 conversion software (Pharmacia) to size the amplified fragments. An example of sizing of chloroplast microsatellites using the automatic ALF Pharmacia sequencer is reported in Figure 1.
Selected polymorphic amplification products were sequenced in order to confirm the presence of the microsatellite regions in the amplified fragments as well as to verify that length variation was due to a different number of repeats within the microsatellite regions and not to mutations in the flanking regions. For this purpose amplified fragments were cloned into a PCR II plasmid vector (Invitrogen) and then sequenced using the ALF automatic sequencer (Pharmacia). The clones were sequenced from both ends, using M-13 universal fluorescent-labelled primers and T7 DNA polymerase (Pharmacia). The sequences were run on 6% polyacrilamide, 7M urea, 0.6x Tris-Borate-EDTA gels at 1500V, 38mA and 34 Watt for 3 hours. Two clones from each cloning experiment were sequenced. An example of the sequencing of a chloroplast microsatellite region in Abies alba is reported in Figure 2.
Molecular organisation of chloroplast microsatellites in two conifer species
Abies alba Mill. (silver fir)
Sequencing was done for those amplification products revealing polymorphism between parents involved in controlled crosses and exhibiting sufficient polymorphism (Pt 30204 and Pt 71936, codes as in Vendramin et al., 1996). Figure 2a gives the sequences for microsatellite locus Pt 30204 of three A. alba individuals (A,B,C) and one A. pinsapo individual. Figure 2b depicts the sequences for microsatellite locus Pt 71936 of A. alba individual C and the A. pinsapo individual. Moreover, in Figures 2a and b, alignment of sequences of the two microsatellite loci was done for the parental Abies individuals and Pinus thunbergii.
Figures 2a and b clearly reveal that the amplified loci contain simple sequence repeats and that their length polymorphism is due to a variable number of repeat units, thus confirming these loci to be chloroplast microsatellites. In the completely sequenced chloroplast genome of Pinus thunbergii (see above) the microsatellite locus Pt 30204 is characterised by a jointly occurring C and T mononucleotide stretch (C)10 x (T)12. In the investigated individuals of Abies this locus turns out to be composed of variable numbers of three mononucleotide repeats (Figure 2a). Microsatellite locus Pt 71936 contains a mononucleotide repeat characterised by a variable number of T for all three species Abies alba, A. pinsapo and P. thunbergii (Figure 2b).
For locus Pt 30204, alignment of sequences exhibits a striking heterogeneity of molecular organisation within the species A. alba (Figure 2a). Individual A is different from conspecific individuals B and C by insertion/deletions within the mononucleotide stretches, an addition of cytosine repeat units, and also by heterologous sequences of the interspersed non-coding sequences. By this organisation, the A. alba individual resembles more that of P. thunbergii (93% homology) than that of the conspecific individuals B and C (e.g. 79% homology to B), while B and C only differ by an insertion/deletion of 1 adenosine in the repetitive stretch. Also striking is the finding that for this microsatellite locus the A. pinsapo individual is more homologous to the A. abies individuals B and C than is A to either B or C.
The molecular organisation of SSR locus Pt 71936 seems to be more conserved throughout all sequences (Figure 2b). Size variations are more or less restricted to variable numbers of repeat units.
Sequence analysis of the microsatellite Pt30205 revealed that in many cases individuals sharing the same size are also identical in sequence. Nevertheless, individuals carrying the same size variants are not always characterised by the same microsatellite sequence, as was discovered by analysing individuals belonging to different populations as well as individuals of the same population. This indicates that size variation may underestimate the underlying sequence variation (Ziegenhagen et al., in preparation).
Picea abies (L.) Karst. (Norway spruce)
Sequence analysis of amplified fragments revealed the occurrence of microsatellites and showed that size variation at the same microsatellite locus was due to variation in the copy number of SSRs (Sperisen et al., 1998). The three microsatellites (Pt 26081, Pt 63718 and Pt 71936, codes as in Vendramin et al., 1996) consisted of A/T mononucleotide repeats. Alignment of the Pinus thunbergii and Norway spruce sequences showed a very high degree of homology. Size variation at chloroplast microsatellite loci Pt 71936 and Pt 63718 was restricted to differences in the copy number of SSRs, with the flanking sequences being identical. The sequences at microsatellites locus Pt 26081 showed variation in the copy number of SSRs and three insertions/deletions and a nucleotide substitution in the regions flanking the SSRs. Moreover, microsatellite locus Pt 71936 of Norway spruce revealed an organisation similar to that of the same microsatellite in silver fir. Both sequences contained a SSR and differed by one insertion/deletion and four nucleotide substitutions in the regions flanking the SSRs.
Inheritance of chloroplast microsatellites
Inheritance of chloroplast microsatellites was tested in Norway spruce (Picea abies K.) by Sperisen et al. (1998) and in silver fir (Abies alba Mill.) by Vendramin and Ziegenhagen (1997).
The mode of inheritance of the chloroplast microsatellites in Norway spruce was analysed in the progenies of seven controlled crosses including a reciprocal cross (Sperisen et al., 1998). The progenies of all crosses exclusively showed the size variant found in the male parent, thus indicating that the three chloroplast microsatellites are paternally inherited (Table 1). The absence of the size variant of the female parent in the embryos appeared to exclude the occurrence of heteroplasmy as a result of maternal leakage.
|
|
|
size variants (bp) |
size variants (bp) |
|
|
|
|
|
|
|
|
|
|
|
|
|
|
|
|
|
|
|
|
|
|
|
|
|
|
|
|
|
|
|
|
|
|
|
|
|
|
|
|
|
|
|
|
|
|
|
|
|
|
|
|
|
|
|
|
|
|
|
|
|
Using primer pairs derived from chloroplast simple sequence repeats of Pinus thunbergii, two polymorphic SSR loci were identified and sequence-characterised in the genus Abies (Vendramin and Ziegenhagen, 1997). PCR products exhibited considerable length variation among six different Abies species and within A. alba. A total of 75 F1 progeny of both an interspecific and an intraspecific reciprocal cross confirmed the two SSRs to be stably inherited and to follow predominantly paternal inheritance (Table 2). When in addition to the embryo of each seed also the primary haploid endosperm (megagametophyte) was analysed, the size variant of the seed parent predominantly occurred, thus giving evidence for the elimination of the maternal plastid only in the egg cell or in the pro-embryos. In Table 3, results are given for PCR amplification of genomic DNA from nine Abies individuals from six different species. From the 11 tested primer pairs, two generated amplification products (Pt 30204 and Pt 71936) which showed considerable length variation among A. alba individuals but also among the six investigated Abies species (Table 3, shaded rows). Seven size variants of PCR products were observed when using primer pair Pt 30204 and eight size variants when using Pt 71936. One primer pair (Pt 15169) exhibited size variation only for the A. cephalonica individual. Six primer pairs produced amplification products, each of identical length for all individuals under study. One primer pair does very poor amplification, and the remaining pair failed to generate any amplification product at all.
Paternal inheritance of chloroplast microsatellites was also tested and confirmed in interspecific crosses between Pinus halepensis Mill. and Pinus brutia Ten. (Anzidei et al., in preparation).
|
|
|
|
|
|
|
|
|
|
||||
| Size variant |
|
(n of N) |
(n of N) |
(n of N) |
|
|
Pt 30204 |
147 136 |
156 139 |
139 (6 of 6) |
||
|
|
147 |
37 |
|
137 (2 of 18) |
|
|
|
37 |
47 |
137 (1 of 33) |
|
|
| Code* |
sense antisense |
size of PCR products [bp] |
||||||||
|
|
|
|
|
|
|
|
|
|
||
| Pt 9383 | AGA ATA AAC TGA CGT AGA TGC CA
AAT TTT CAA TTC CTT TCT TTC TCC |
|
||||||||
| Pt 15169 | CTT GGA TGG AAT AGC AGC C
GGA AGG GCA TTA AGG TCA TTA |
|
|
|
|
|
|
|
|
|
| Pt 26081 | CCC GTA TCC AGA TAT ACT TCC A
TGG TTT GAT TCA TTC GTT CAT |
|
|
|
|
|
|
|
|
|
| Pt 30204 | TCA TAG CGG AAG ATC CTC TTT
CGG ATT GAT CCT AAC CAT ACC |
|
|
|
|
|
|
|
|
|
| Pt 36480 | TTT TGG CTT ACA AAA TAA AAG AGG
AAA TTC CTA AAG AAG GAA GAG CA |
|
|
|
|
|
|
|
|
|
| Pt 41093 | TCC CGA AAA TAC TAA AAA AGC A
CTC ATT GTT GAA CTC ATC GAG A |
|
||||||||
| Pt 48210 | CGA GAT TGA TCC GAT ACC AG
GAG AGA ACT CTC GAA TTT TTC G |
|
|
|
|
|
|
|
|
|
| Pt 71936 | TTC ATT GGA AAT ACA CTA GCC C
AAA ACC GTA CAT GAG ATT CCC |
|
|
|
|
|
|
|
|
|
| Pt 79951 | CTT TTG TTT TTC AAC AAT TGC A
ACA TCT ATC TCC CAT ATC GGC |
|
|
|
|
|
|
|
|
|
| Pt 87268 | GCC AGG GAA AAT CGT AGG
AGA CGA TTA GAC ATC CAA CCC |
|
|
|
|
|
|
|
|
|
| Pt 110048 | TAA GGG GAC TAG AGC AGG CTA
TTC GAT ATT GAA CCT TGG ACA |
|
|
|
|
|
|
|
|
|
Table 3: Size of PCR products obtained amplifying genomic DNA of six Abies species with 11 primer pairs matching flanking regions of simple sequence repeats (SSRs) in cpDNA of Pinus thunbergii (Wakasugi et al. 1994) (from Vendramin and Ziegenhagen, 1997). * denotes the position of the 5' base of sense primer in the published P. thunbergii cpDNA sequence. Individuals No.1: A. alba A; 2: A. alba B; 3: A. alba C; 4: A. nordmanniana; 5: A. cilica; 6: A. numidica; 7: A. pinsapo; 8: A. nordmanniana; 9: A. cephalonica
Universality of chloroplast microsatellite markers
The identification of microsatellite regions is a very expensive and time-consuming process, which generally requires the construction and screening of a genomic library (efficient protocols for the enrichment in microsatellites are available, e.g. Edwards et al., 1996). Therefore great efforts are necessary for sequencing and for the optimisation of the markers. Generally not more than 25% of the identified microsatellites are single locus Mendelian markers. A possible strategy to try to increase the efficiency of the identification of microsatellite regions, besides the construction of enriched libraries, may be represented by the possibility to transfer microsatellite markers developed in one species to others in order to reduce the costs of their development.
In the case of nuclear microsatellites, this strategy has been proved to be not very efficient. Echt et al. (1998), for example, using SSR primer pairs from Pinus strobus and Pinus radiata, found that while primers for monomorphic loci could amplify loci from a wide range of species, the primers for informative dinucleotide repeat loci could only amplify loci from species within the same subgenus. Primers for the amplification of nuclear microsatellites in Pinus halepensis also work in the closely related species Pinus brutia (Keys et al., 1999). Twenty-five primer pairs developed for Pinus halepensis were also tested in Pinus pinaster, but only one of them produced polymorphic amplification products that showed only a single band per haploid genome; the remaining 24 pairs produced either no amplification product, single monomorphic bands, or multiband patterns (Mariette et al., 1999).
For the chloroplast genome, on the contrary, the high level of DNA sequence conservation, including the arrangements of genes and intergenic sequences in conifers as well as in angiosperms, confer to the cpSSR markers a very high degree of "universality". Thus, primers designed on the basis of the sequences of the chloroplast genome of Pinus thunbergii also worked in many other conifers (Powell et al., 1995; Vendramin et al., 1996) as well as in angiosperms (Cato and Richardson, 1996). The high degree of conservation of sequences in the chloroplast genome of conifers was also confirmed by studies performed by Vendramin et al. (1996) in Pinus leucodermis, Vendramin and Ziegenhagen (1997) in Abies alba and Sperisen et al. (1998) in Picea abies. These primers have been used with success in 110 different conifer species belonging to different taxonomic classifications, in particular to the Pinaceae, Cupressaceae and Taxodiaceae (Vendramin et al., unpublished data), thus dramatically reducing the cost of development of these markers. Sequencing data in Picea abies, Abies alba, Pinus halepensis, Pinus brutia, Pinus pinaster, Pinus pinea, and Pinus cembra always confirmed the presence of the microsatellite region in the amplified fragments. Analyses are also in progress to verify the presence of cpSSRs in the amplified fragments of Cupressus sempervirens and Taxus baccata. The detection of a typical 1bp variation of the amplified fragments of different individuals of Cupressus sempervirens seems to be evidence of the presence of cpSSR regions also in the Cupressaceae.
Equipment and cost
In principle, only basic molecular biology facilities are necessary for the analysis of chloroplast microsatellite polymorphism, such as a PCR thermal cycler and a system for vertical gel electrophoresis. However, considering that chloroplast microsatellites are repetitions of a single nucleotide and that therefore single base length variation must be detected, a system with high resolution (sequencing gel apparatus) should be available. High accuracy for sizing the amplified fragments can be obtained using internal and external standards of known molecular weight (see Figure 1).
The efficiency of the screening can, however, be increased considerably through the automation of the procedures: multiplex of PCR reaction and/or multiple loading of a single gel (at least twice) as well as the use of automated DNA sequencing apparatus (which does not require radioactive labelling) with appropriate software can speed up and automate the genotyping to a considerable extent. The use of a robotic workstation equipped with a multi-channel pipettor allows the preparation of 96 amplification reactions in about 20 minutes. The simultaneous use of a Beckman 2000 robotic workstation and of an ALF automatic sequencer with the software Fragments Manager version 1.2 allows the amplification and sizing of 300 to 500 samples with three chloroplast microsatellites per day per operator.
Case studies
Geographic distribution of the diversity
Picea abies
Three chloroplast microsatellites (cpSSRs), previously sequence-characterised and for which paternal inheritance was tested and confirmed (Sperisen et al., 1998), were used to assess their usefulness as informative markers for phylogeographic studies in Norway spruce (Picea abies) and to detect spatial genetic differentiation related to the possible recolonization processes in the post-glacial period (Vendramin et al., 2000). Ninety-seven populations were included in the survey. Some 8, 7 and 6 different size variants for the three cpSSRs, respectively, were scored by analysing 1,105 individuals. The above 21 variants combined into 41 different haplotypes. The distribution of some haplotypes showed a clear geographic structure and seems to be related to the existence of different refugia during the last glacial period (Figure 3). The haplotype 03 (116/96/144 as variant size at the three loci analysed, respectively) was present only in Scandinavia and northeastern and southeastern Europe, while the haplotype 04 (116/100/143) was detected only in the western part of the natural range (Central Europe and the Alps - Figure 3). The analysis of chloroplast SSR variation revealed the presence of two main gene pools (Sarmathic-Baltic and Alpine-Centre European) and a relatively low degree of differentiation (Rst (Slatkin, 1995) of about 10%), characteristic of tree species with large distribution and probably influenced by intensive human impact on this species. No evidence for the existence of additional gene pools (e.g. from Balkan and Carpathian glacial refugia) were obtained, though the existence of genetic discontinuity within the species' European range was observed (Figure 4).
Geostatistics was applied to the chloroplast simple sequence repeats (cpSSR) haplotype-frequency data from the 95 European Norway spruce populations (Bucci and Vendramin, 2000) to provide preliminary evidence about the following issues: 1) delineation of genetically homogeneous regions ('genetic zones'); 2) prediction of their haplotype frequencies and definition of related criteria to be applied for provenance identification and certification of seedlots; 3) construction of a continental-scale 'availability map' of the intraspecific biodiversity for Norway spruce. Direct evidence for large-scale geographic structure over the European natural range was obtained, detecting both geographic clines and stationary patterns. The increase of the mean genetic divergence by geographic distances (up to about 1,800 km) provided a strong hint that geographic distance is a major factor for differentiation in Norway spruce. Haplotype-frequency surfaces were obtained by applying ordinary kriging to sampling frequency data. Cluster analysis carried out on haplotype-frequency surfaces revealed a fair discrimination among 16 genetic zones (Figure 5). Dendrogram analysis carried out on the predicted mean haplotype frequency confirmed a fairly good separation of the detected genetic zones (Figure 6).
Application of geostatistical analysis to the large amount of genetic data is a promising tool for the analysis of complex geographic patterns aimed to reconcile appropriate conservation strategies and breeding exploitation of genetic resources.
Abies alba
Based on two polymorphic chloroplast microsatellites that had been previously identified and sequence-characterised in the genus Abies (Vendramin and Ziegenhagen, 1997), genetic variation was studied in a total of 714 individuals from 17 European silver fir (Abies alba Mill.) populations distributed all over the natural range (Vendramin et al., 1999). Eight and 18 different length variants at the two loci, which combined into 90 different haplotypes, were detected (Figure 7). Genetic distances between most populations as measured by d0 (Gregorius 1984) were high and significant. There is also evidence for spatial organisation of the distribution of haplotypes, as shown by permutation tests, which demonstrate that genetic distances increase with spatial distances (Figure 8). Large heterogeneity in diversity across populations was observed, as measured by the number of haplotypes, by the unbiased index of diversity of Nei (1973) as well as by allelic richness. Furthermore, there is good congruence in the levels of allelic richness of the two loci across populations. The present organisation of levels of allelic richness across the range of the species is likely to have been shaped by the distribution of refugia during the last glaciation and the subsequent recolonization processes. Mainly, processes of genetic drift due to bottleneck and effects of isolation could be inferred from the obtained data.
Pinus halepensis (Aleppo pine) and Pinus brutia (Brutian pine)
Nine chloroplast, paternally inherited SSR markers were used to describe genetic variation of the two closely related species belonging to the halepensis complex (P. halepensis Mill. and P. brutia ten.). They reveal a large polymorphism both within and among populations (Bucci et al., 1998). The high level of among-population genetic divergence (Rst, Slatkin, 1995) found for P. halepensis and the low within-population haplotypic diversity (except for Greek and Southern Italian stands) (Sw, Slatkin, 1995) are consistent with the hypothesis of a recent expansion of the species (last 10,000 years), with colonising populations establishing by migration of a limited number of individuals (founder effect) and/or population dynamics regulated by fire (population bottlenecks). Analysis of the geographic distribution of haplotypic diversity revealed two main groups of Aleppo pine populations: a central Mediterranean group, centred on southern Italy and comprising northern Italian and Spanish populations; and a southern Mediterranean group, centred on Greece. Almost all the haplotypic diversity detected in this species is concentrated in a very limited area located in Greece, which is considered to be the centre of origin of the species from which the recolonization in the post-glacial period started (Morgante et al., 1998). For P. brutia, no clear geographic structure was found, even though the degree of genetic differentiation was relatively high (Rst of about 30%).
Paternity analysis and detection of natural hybridisation (introgression)
Abies alba
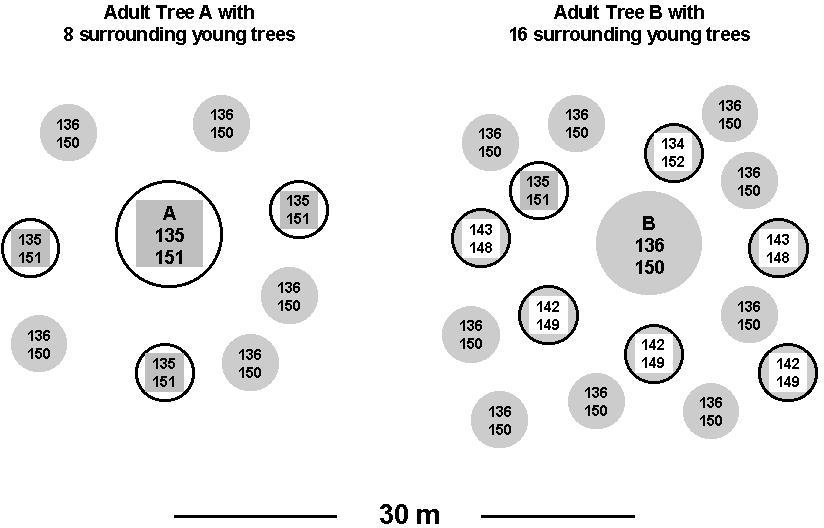
Two relatively isolated adult trees about 30 m apart, as well as 24 naturally regenerated young trees in their direct neighbourhood, were analysed at two chloroplast microsatellite loci (Ziegenhagen et al., 1998). Among all adult and young trees, five different length variants were found for each of the two microsatellites. Observed individual combinations of the size variants of the two loci allowed the definition of five different haplotypes. Figure 9 schematically represents the spatial distribution of the two adult trees (A and B) and the surrounding young trees. Each individual is characterised by the length variants at both microsatellite loci and the relevant two-locus-haplotype. The results reveal that the two adult trees can be distinguished by both microsatellite loci. Comparison of the haplotypes of the adult trees and of the surrounding young trees indicates that, for six out of 16 young trees, paternity of either A or B can unambiguously be excluded. The study demonstrates the potential usefulness of a novel molecular approach towards paternity analysis in a conifer species.
Pinus halepensis and Pinus brutia
Three "diagnostic" markers showing size variants clearly distinguishing P. halepensis from the P. brutia were used to throw light on the occurrence of natural hybridisation in a Turkish sympatric population of P. halepensis and P. brutia (Bucci et al., 1998). Strong evidence of introgression of "halepensis" haplotypes into P. brutia seeds (but not vice versa) was detected. The overall hybridisation rate was estimated to be about 11 % of the total number of matings analysed (Table 4). Possible explanations for the observed unidirectional, interspecific gene flow are: 1) differential impollination success (for example, in terms of pollen tube growth rate); 2) unbalanced potential pollen donors (for example, due to different stand density and/or differential stage of P. halepensis and P. brutia individuals); 3) embryo abortion of P. brutia (male) x P. halepensis (female) hybrids due to a cellular or molecular mechanism of incompatibility. Previously reported evidence on artificial crossings indicates that the last explanation can be considered a useful working hypothesis for further research.
| No. | Haplotype |
|
|
Overall | Type | ||||
| Embr | Mega | Allo | Embr | Mega | Allo | ||||
|
|
107 120 76 |
|
|
|
|
|
|
|
brutia |
|
|
108 119 76 |
|
|
|
|
|
|
|
brutia |
|
|
|
|
|
|
|
|
|
|
brutia |
|
|
|
|
|
|
|
|
|
|
brutia |
|
|
|
|
|
|
|
|
|
|
brutia |
|
|
108 122 76 |
|
|
|
|
|
|
|
brutia |
|
|
|
|
|
|
|
|
|
|
brutia |
|
|
112 114 82 |
|
|
|
|
|
|
|
halepensis |
|
|
|
|
|
|
|
|
|
|
halepensis |
|
|
|
|
|
|
|
|
|
|
halepensis |
| Sample size |
|
|
|
|
|
|
|
||
| No. Haplotypes |
|
|
|
|
|
|
|
||
Table 4: Analysis of the occurrence of natural hybridization in a sympatric populations (Kiranköy - Turkey) of P. halepensis and P. brutia. Three `diagnostic' cpSSR marker loci (Pt26081, Pt36480, and Pt41093) showing size variants clearly distinguishing P. halepensis from P. brutia were used. `Embr' and `Mega' refer to embryos and megagametophytes collected from trees of the sympatric population of the two species, `Allo' refers to embryos collected from trees of the allopatric populations of the two species. `Type' refers to the classification of the haplotypes based on the similarity with those detected in allopatric populations. Haplotypes for the same three loci detected in allopatric stands but not in the sympatric population are not reported. Overall sample size and number of haplotypes detected (last two rows) include also the individuals in allopatry not displayed here (from Bucci et al., 1999).
Conclusions
Chloroplast microsatellite analysis represents an extremely useful and informative approach for studying population history, for monitoring gene flow and hybridisation and for identifying areas harbouring high levels of genetic diversity in conifer species. For all the species studied so far, these markers showed a high degree of length polymorphism, both within and among populations. As far as allozyme data exist for comparison and fixation within populations is measured by Gst, fixation at cpSSR marker loci is significantly higher than at the allozyme loci. In comparison to species with maternally inherited chloroplast DNA polymorphism, however, Gst values for paternally inherited cpSSRs in conifers are lower. Long-range pollen dispersal as well as different mutation rates may be argued for that. This makes paternally inherited highly polymorphic cpSSRs in conifers less suitable for tracing long-range recolonization routes for intraspecific spatial phylogeny. In contrast they are the most advantageous markers for tracing past genetic process like drift or isolation due to the combined property of the high degree of polymorphism and uniparental inheritance, the latter marking one-half the size of reproductively effective population size compared to the parentally inherited markers. Moreover they are characterised by a high degree of "universality", thus allowing the transfer of primers from one species to others belonging to different taxonomic classifications and therefore obviating the need and expense to develop primers independently for each species. Limited technological investments are required for the analysis of chloroplast microsatellite variation. Moreover, primers and methods developed in one lab can be easily transferred to other laboratories, with a high degree of reproducibility. The approach and the method of detection can also be automated to a large extent, increasing dramatically its efficiency and allowing to obtain a large set of data in a relatively short period of time. The availability of a large set of data represents an important requisite for the development of maps of the distribution of genetic resources of forest tree species: distribution maps are useful tools for an appropriate definition of programmes for the conservation of biodiversity.
References
Bucci G, Anzidei M, Madaghiele A, Vendramin G G (1998) Detection of haplotypic variation and natural hybridization in halepensis-complex pine species using chloroplast SSR markers. Molecular Ecology 7: 1633-1643.
Bucci G, Vendramin GG (2000) Delineation of genetic zones in the European Norway spruce natural range: preliminary evidences. Molecular Ecology (submitted).
Cato SA, Richardson TE (1996) Inter- and intraspecific polymorphism at chloroplast SSR loci and the inheritance of plastids in Pinus radiata D. Don. Theor. Appl. Genet. 93: 587-592.
Dumolin S, Demesure B, Petit RJ (1995) Inheritance of chloroplast and mitochondrial genomes in pedunculate oak investigated with an efficient PCR method. Theor. Appl. Genet. 91: 1253-1256.
Echt CS, De Verno LL, Anzidei M, Vendramin GG (1998) Chloroplast microsatellites reveal population genetic diversity in red pine, Pinus resinosa Ait. Molecular Ecology 7: 307-317.
Edwards KJ, Barker JHA, Daly A, Jones C, Karp A (1996) Microsatellite libraries enriched for several microsatellite sequences in plants. BioTechniques 20: 758-760.
Goldstein DB, Linares AR, Cavalli-Sforza LL, Feldman MW (1995) An evaluation of genetic distances for use with microsatellite loci. Genetics 139: 463-471.
Gregorius H-R (1984) A unique genetic distance. Biometrical Journal 26: 13-18.
Jarne P, Lagoda JL (1996) Microsatellites, from molecules to population and back. Tree 10: 424-429.
Mariette S, Chagne D, Decroocq S, Vendramin GG, Lalanne C, Madur D, Plomion C (2000) Microsatellite markers for Pinus pinaster Ait. Can. J. For. Res., submitted.
Morgante M, Felice N, Vendramin GG (1997) Analysis of hypervariable chloroplast microsatellites in Pinus halepensis reveals a dramatic genetic bottleneck. In: Karp A, Isaac PG, Ingram DS (eds.). Molecular Tools for Screening Biodiversity - Plants and Animals. London: Chapman and Hall, pp. 407-412.
Nei M (1973) Analysis of gene diversity in subdivided populations. Proc. Natl. Acad. Sci. USA 70: 3321-3323.
Powell W, Morgante M, McDevitt R, Vendramin GG, Rafalski JA (1995) Polymorphic simple sequence repeat regions in chloroplast genomes: Applications to the population genetics of pines. Proc. Natl. Acad. Sci. USA 99: 7759-7763.
Slatkin M (1995) A measure of population subdivision based on microsatellite allele frequencies. Genetics 139: 457-462.
Soranzo N, Provan J, Powell W (1999) An example of microsatellite length variation in the mitochondrial genome of conifers. Genome 42: 158-161.
Sperisen C, Büchler U, Mátyás G, Anzidei M, Madaghiele A, Skrøppa T, Vendramin GG (1998) Polymorphic tandem repeats in the chloroplast and mitochondrial genomes of Norway spruce. In: Skrøppa T, Paule L, Gömöry D (eds.). Genetics and Breeding of Norway Spruce. Arbora Publisher, Zvolen, Slovakia, pp. 15-24.
Tautz D (1993) Notes on the definition and nomenclature of tandemly repetitive DNA sequences. In: Pena SDJ, Chakraborty R, Epplen JT, Jeffreys AJ (eds.). DNA Fingerprinting: State of the Science. Birkhauser Verlag, Basel, Switzerland, pp. 21-28.
Valdes AM, Slatkin M, Freiner NB (1993) Allele frequencies at microsatellite loci: the stepwise mutation model revisited. Genetics 133: 737-749.
Vendramin GG, Lelli L, Rossi P, Morgante M (1996) A set of primers for the amplification of 20 chloroplast microsatellites in Pinaceae. Molecular Ecology 5: 111-114.
Vendramin GG, Ziegenhagen B (1997) Characterisation and inheritance of polymorphic plastid microsatellites in Abies. Genome 40: 857-864.
Vendramin GG, Degen B, Petit RJ, Anzidei M, Madaghiele A, Ziegenhagen B (1999) High level of variation at Abies alba chloroplast microsatellite loci in Europe. Molecular Ecology 8: 1117-1126.
Vendramin GG, Anzidei M, Madaghiele A, Sperisen C, Bucci G (2000) Chloroplast microsatellite analysis reveals the presence of population subdivision in Norway spruce (Picea abies K.). Genome, in press.
Wakasugi T, Tsudzuki J, Ito S, Shibata M, Sugiura M (1994) A physical map and clone bank of the black pine (Pinus thunbergii) chloroplast genome. Plant Mol. Biol. Rep. 12: 227-241.
Weising K, Gardner C (1999) A set of conserved PCR primers for the analysis of simple sequence repeat polymorphism in chloroplast genomes of dicotyledonous angiosperms. Genome 42: 9-19.
Ziegenhagen B, Scholz F, Madaghiele A, Vendramin GG (1998) Chloroplast microsatellites as markers for paternity analysis in Abies alba. Can. J. For. Res. 28: 317-321.
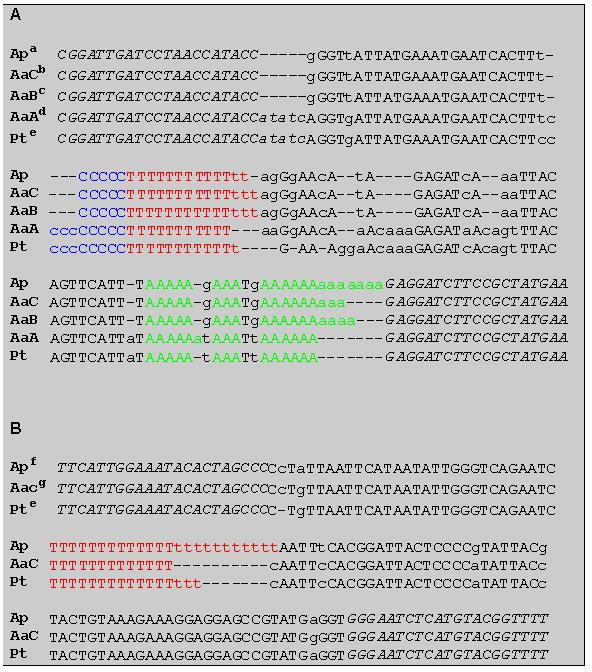
Ap (Abies pinsapo), AaA (Abies alba A), AaB (Abies alba B), AaC (Abies alba C), and Pt (Pinus thunbergii). Types in italics are sequences of the primers, lowercase types indicate nucleotide substitutions and dashes stand for deletions. Coloured sequences indicate the microsatellite stretches.
a Vendramin and Ziegenhagen, unpublished, b Vendramin
and Ziegenhagen, unpublished, c GenBank accession No. U82922,
d
Vendramin and Ziegenhagen, unpublished e DDBV accession No.
D11467, f GenBank accession No. U2923, g GenBank
accession No. U2924 (from Vendramin and Ziegenhagen, 1997).
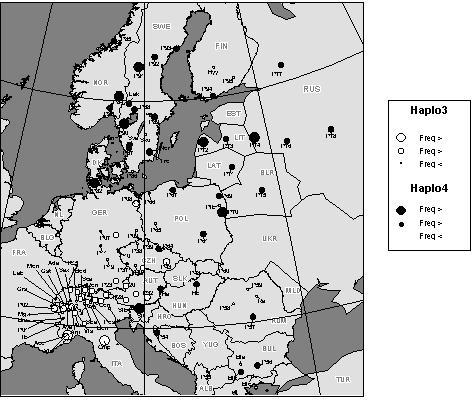
Figure 3: Geographic distribution of cpSSR haplotypes
116/96/144
(Haplo03) and 116/100/143 (Haplo04, allele size at the three loci
Pt 26081, Pt 63718, and Pt 71936, respectively) across the Norway spruce
natural range. Circles representing the populations are proportional to
the relative within-stand haplotype frequency (from Vendramin
et al.,
2000).
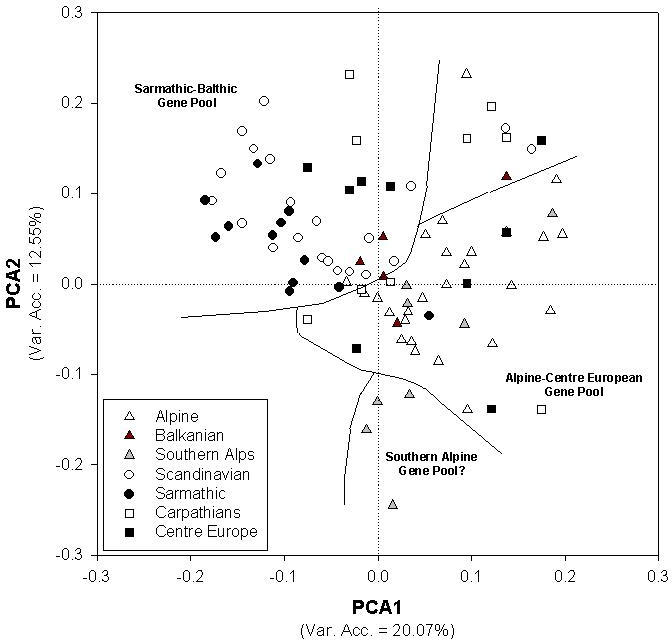
Figure 4: Plot of the first two components of the standardized
PCA carried out on transformed haplotype frequencies. Stands belonging
to the same geographic area are shown by the same symbol. Despite the large
genetic noise and the continuous variation across the range, a fairly good
separation between two main group of populations ("Sarmathic-Baltic" group,
including population from western Russia and Fennoscandia, and "Alpine
- Centre European" group, including populations from Italy, Switzerland,
Austria, Slovenia) can be recognized. Balkanian stands were clustered at
the boundary between the two main gene pools, while centre-European and
Carpathian populations were scattered all over the two groups. A third,
possible group of populations including stands from south-western Alps
was detected. Lines delimiting gene pools were drawn arbitrarily (from
Vendramin et al., 2000).
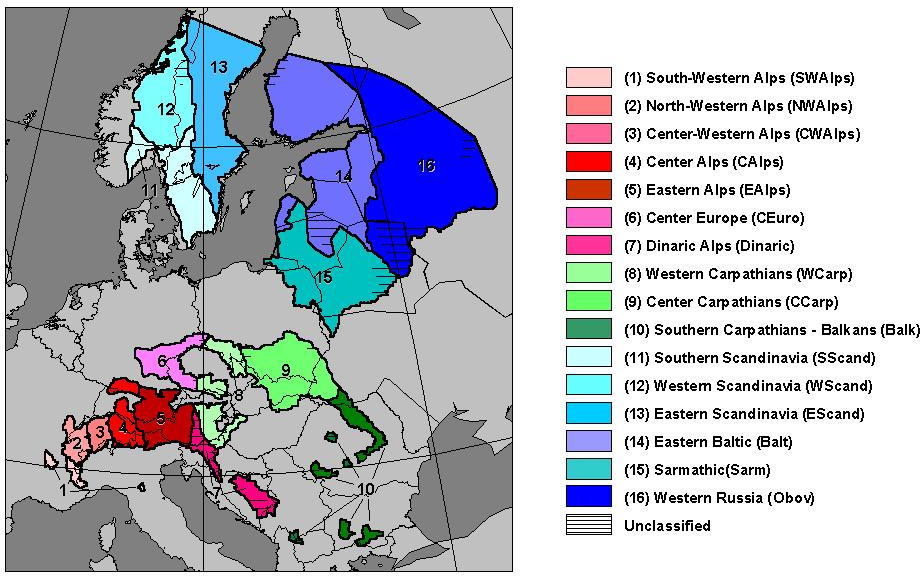
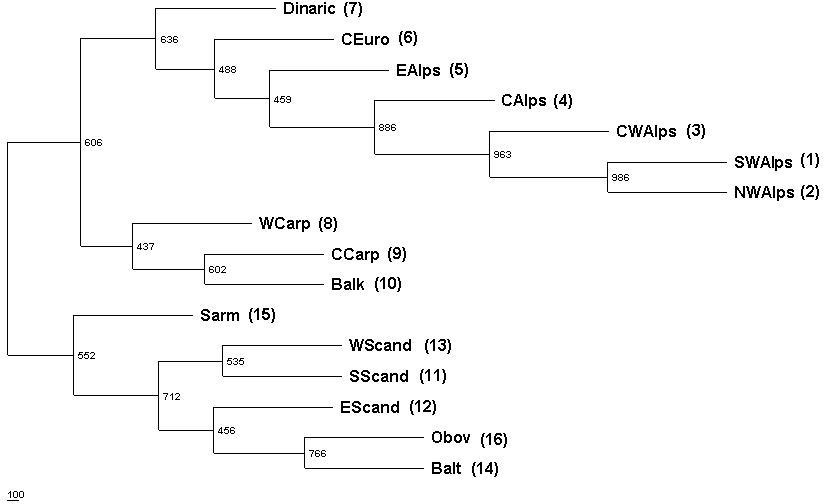
Figure 6: Majority-rule consensus tree obtained by restricted
maximum likelihood method (reml) on transformed mean haplotype frequencies
for each genetic zone. Bootstrap values (N = 1000) are indicated at each
node (from Bucci and Vendramin, 2000).
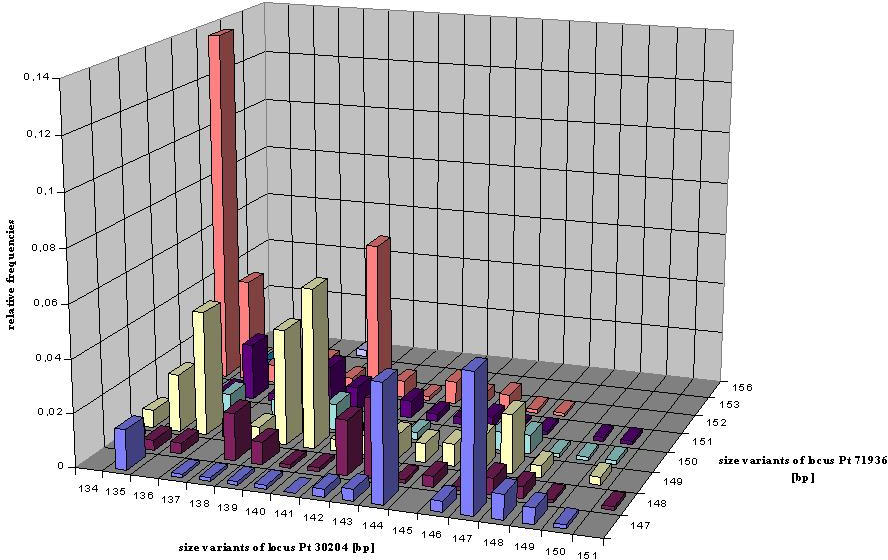
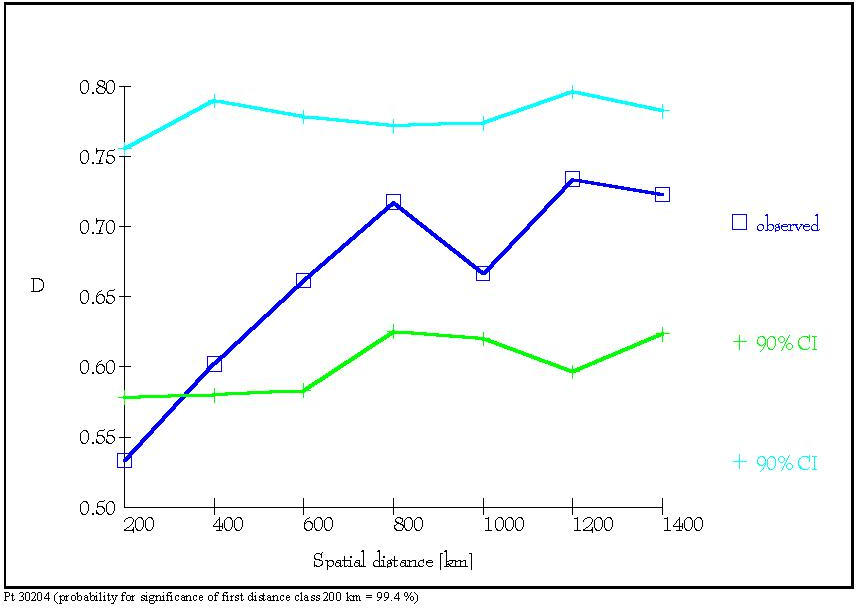
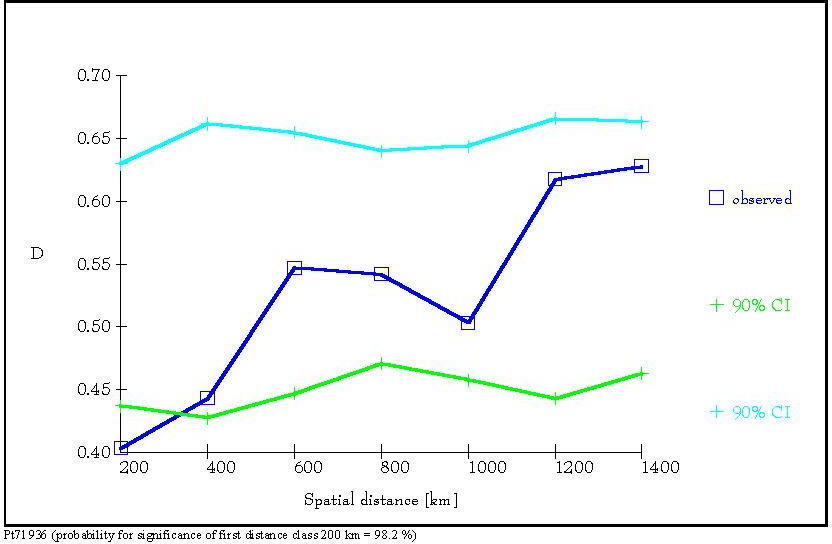
Figure 8: Distogram of the average (D) of the genetic distances
d0
(Gregorius
1984) of all pairs of individuals belonging to each of seven spatial distance
classes. The 90% confidence interval of 1000 permutations is presented.
(a):
Distogram of average genetic distance D estimated for locus Pt 30204. (b):
Distogram of average genetic distance D estimated at locus Pt 71936 (from
Vendramin et al., 1999).
© Institut für Forstgenetik und Forstpflanzenzüchtung, Universität Göttingen, 1999