FAQ
Lee
LaFleur
Cornell University
ljl26@cornell.edu
My institution
is interested in monitoring the use of our online resources. Is Web log
analysis an effective means of doing this?
Recently a
number of organizations, including the Digital
Library Federation (DLF) and the Association
of Research Libraries (ARL), have urged libraries to take responsibility
for documenting the use of the digital resources they manage. The ARL
New Measures Initiative has issued their Emetrics
Phase II report, offering guidelines for usage statistics that libraries
should collect in order to document changes in the use of Web-based resources.
It is recommended that libraries begin tracking the number of downloads,
page views, queries and search sessions by users. Statistics such as these
can be obtained by examining the data produced by the Web servers on which
these resources are stored. Each transaction on the Web consists of a
request issued through the client's browser and a corresponding response
from the Web server. These transactions are automatically recorded by
the server in files known as Web logs.
The data stored in Web log files consists of long strings of text and
numerical data, so reading them can be very difficult and unintuitive.
You will probably want to use a log file analysis program to interpret
the data. These programs are available as shareware or through various
commercial vendors. Some types of log analysis software run on the administrator's
desktop, in which case the log files must be transferred from the server
to the desktop before analysis is carried out. Other analysis programs
run on the server itself and can gather data from the log files directly,
either in "real time" or at scheduled intervals. Depending on
the size of the log file and the capacity of the hardware, the analysis
process can be labor intensive and time consuming. In general, the more
detailed the analysis desired, the more complicated and expensive the
software tends to be.
The software works by comparing different data sets from the logs and
making inferential calculations based on a number of factors. For example,
the length of a "visit" is generally determined by calculating
the difference between the date/time stamp of a user's arrival and departure
requests. "Visits" are determined by counting requests from
a single IP address over a period of time. After a preset period of inactivity
(e.g., 30 minutes) on a Web page or site, a visit is considered terminated.
Any activity that occurs after this time period by the same user would
then be counted as a new visit.
Some analysis software packages offer details on the geographic location
of users, even down to the city level. More expensive packages can analyze
log file types from a wide variety of servers (Apache, Microsoft IIS,
Netscape, etc.) Higher end software packages may provide hundreds of different
types of reports. Some offer customizable reports, generated on the fly
from databases in which the analyzed data is stored. Such reports may
list the top pages visited or the number of unique visitors, and some
provide reports that may be re-sorted for viewing along any number of
different variables. Most commercial analysis programs also offer some
type of graphing function through which the report data may be represented
visually. Select packages also allow the user to download data from the
report into PDF, Word documents or Excel spreadsheets.

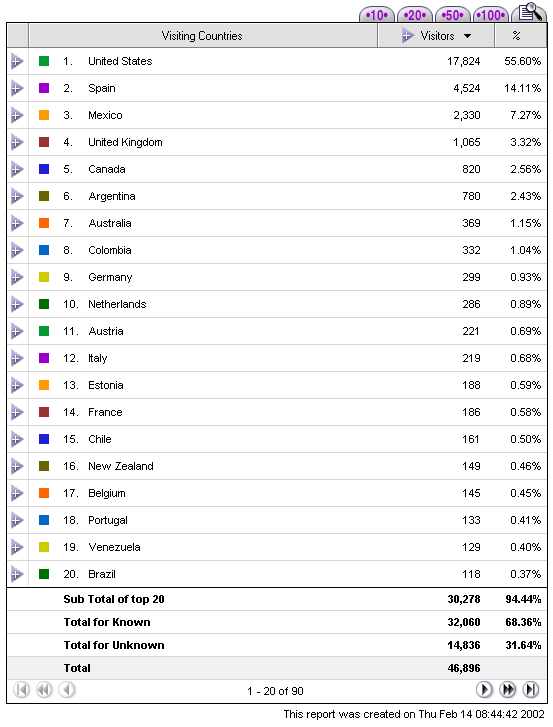
Figure 1. Screenshot from WebTrends
Live showing the top twenty countries from which visitors came when
they visited the Cornell Department of Preservation and Conservation Web
site.

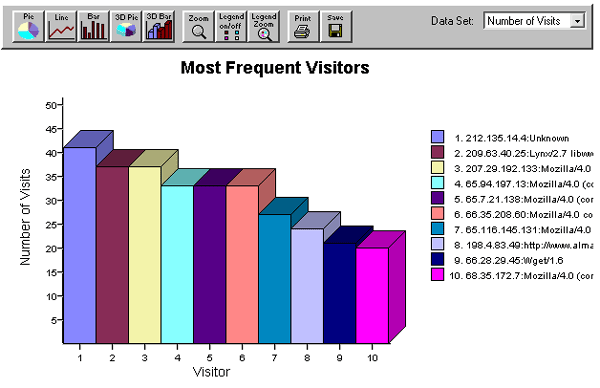
Figure
2. Screenshot from NetTracker
Log Analysis software package showing the
top ten visitors to the Louis
Agassiz Fuertes Web site.
"Live tracking" is another means of analyzing Web traffic that
is often used to obtain detailed information about online users. Live
trackers are typically third party services that monitor Web traffic by
requiring Web site administrators to place special JavaScript code into
each of their Web pages. Thus, live tracking doesn't rely on Web logs
at all. Instead usage data is derived through the JavaScript each time
a page on your site is loaded. Like Web logging, this method also requires
an analysis process, but in this case the work is usually done by the
live tracking service and you receive a finished report. Live tracking
results are usually available in real time, allowing up-to-the minute
reporting. Compared to Web log analysis, live tracking can provide an
equally in-depth analysis of Web traffic activity, while also offering
a more detailed profiling of users' system requirements. The JavaScript
employed in live tracking can identify a variety of user display properties,
including monitor resolution, pixel dimensions and bit depth, screen widths
and available color palettes, as well as information on whether or not
cookies (a technology for passing personalized data between Web clients
and servers), Java, and JavaScript are enabled. When combined with data
on users' Internet connection speeds, this information can help guide
decisions about the presentation of digital information, including images.

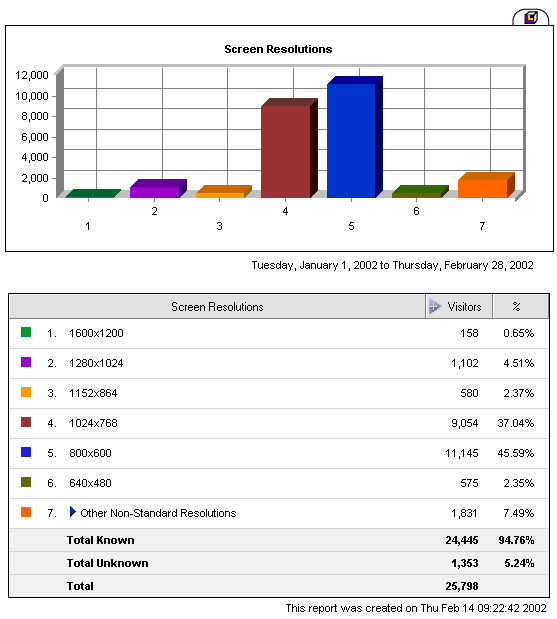
Figure 3.
This report lists the most common screen resolutions used by visitors
to Cornell's Preservation site. Screen resolutions are given in terms
of pixel dimensions.
Web traffic analysis can be a valuable asset to librarians who want to
understand current and potential users of their collections. User statistics
can help libraries gain continued funding and administrative support for
new and existing digital projects. By analyzing the contents of Web log
files, we can learn a great deal about online visitors and about which
resources are being used and which ones are not. Such data can assist
librarians and archivists in answering questions of whether users are
visiting expected pages, which sections they are spending the most time
on, and which types of content they appear to be most interested in. Web
server administrators can rely on user data to assess file structure and
server load over the network. Libraries can determine users' locations
(by IP address), and which referring Web pages (links), search engines,
and keywords (queries) are transporting them to the digital library. Log
files can also provide some indication of whether users are navigating
a Web site or resource properly based on click stream data that allows
us to see the paths (internal references) through which users are traveling,
as well as information on which pages they visit first, which pages they
exit from, how long they stay, and what files they choose to access. Log
file data allows libraries to assess the number of files that have been
downloaded and those for which the download was aborted. The logs also
identify any errors that may occur during an online transaction. Additionally,
log files contain technical information regarding the user's operating
system and Web browser, which is of interest in designing resources for
the system requirements of particular audiences.
There are many good reasons for libraries to use Web traffic analysis
software. However, there are a number of important factors to keep in
mind. Usage data does not provide rich qualitative information, such as
a user's overall satisfaction with resources, and it certainly won't explain
why people are searching for particular information. In this regard Web
traffic analysis is not a substitute for more qualitative studies (focus
groups, surveys, etc.) that the library should also be conducting.
Web traffic and log analysis is essentially an inferential process that
relies on heuristic specifications set up by the companies that design
the software. Although the reports provide a helpful view of user interaction
with library resources, much of the information may be inconclusive. Different
software packages use different methods for deriving their reports, and
the lack of documentation for many analysis programs makes some of their
specifications suspect. For instance, the prevalent use of robots or spiders
over the Internet may affect the accuracy of user statistics. Robots are
commonly used to comb the Web for data, and when doing so they make frequent
visits to each page on a Web site. Analysis programs attempt to control
for robots, but many of these visits still slip through the cracks, thereby
inflating the number of "actual" reported visitors.
| Additional
Sources of Information
There are many Web log analysis software packages and services available, and the market is in much flux. The following sites may prove helpful in evaluating the various products currently in use. Dan
Grossman, "Analyzing
Your Web Site Traffic," iBoost Journal Software
QA/Test Resource Center, "Web
Site Test Tools and Site Management Tools" Makiko
Itoh, "Web
Site Statistics: How, Why and What to Count" "Web
Site Analysis,"
from PC Magazine (June 27, 2000) Elaine
Nowick, "Using
Server Logfiles to Improve Website Design," Library
Philosophy and Practice, Vol. 4, No.1 (Fall 2001) |
![]()
Publishing
Information
RLG DigiNews
(ISSN 1093-5371) is a newsletter conceived by the members of the Research
Libraries Group's PRESERV community. Funded in part by the Council on
Library and Information Resources (CLIR) 1998-2000, it is available internationally
via the RLG PRESERV
Web site (http://www.rlg.org/preserv/). It will be published six times
in 2001. Materials contained in RLG DigiNews are subject to copyright
and other proprietary rights. Permission is hereby given for the material
in RLG DigiNews to be used for research purposes or private study.
RLG asks that you observe the following conditions: Please cite the individual
author and RLG DigiNews (please cite URL of the article) when using
the material; please contact Jennifer
Hartzell, RLG Corporate Communications, when citing RLG DigiNews.
Any use other than for research or private study of these materials requires
prior written authorization from RLG, Inc. and/or the author of the article.
RLG DigiNews is produced for the Research Libraries Group, Inc. (RLG)
by the staff of the Department of Preservation and Conservation, Cornell
University Library. Co-Editors, Anne R. Kenney and Nancy Y. McGovern;
Production Editor, Barbara Berger Eden; Associate Editor, Robin Dale (RLG);
Technical Researchers, Richard Entlich and Peter Botticelli; Technical
Coordinator, Carla DeMello.
All links in this issue were confirmed accurate as of February 14, 2002.
Please send your comments and questions to preservation@cornell.edu.
![]()